
A good conversion rate for ecommerce is defined as any rate that exceeds your specific industry and device benchmarks, typically falling between 1.4% and 8.5% depending on product category, traffic source, and device mix. The industry term for improving this metric is Conversion Rate Optimization, or CRO. Most store owners fixate on a single number without realizing that a 2% rate can be excellent for a luxury jewelry brand and catastrophic for a food subscription service. Understanding where you actually stand requires benchmarking against the right peer group, not a generic global average.
What is a good conversion rate for ecommerce in 2026?
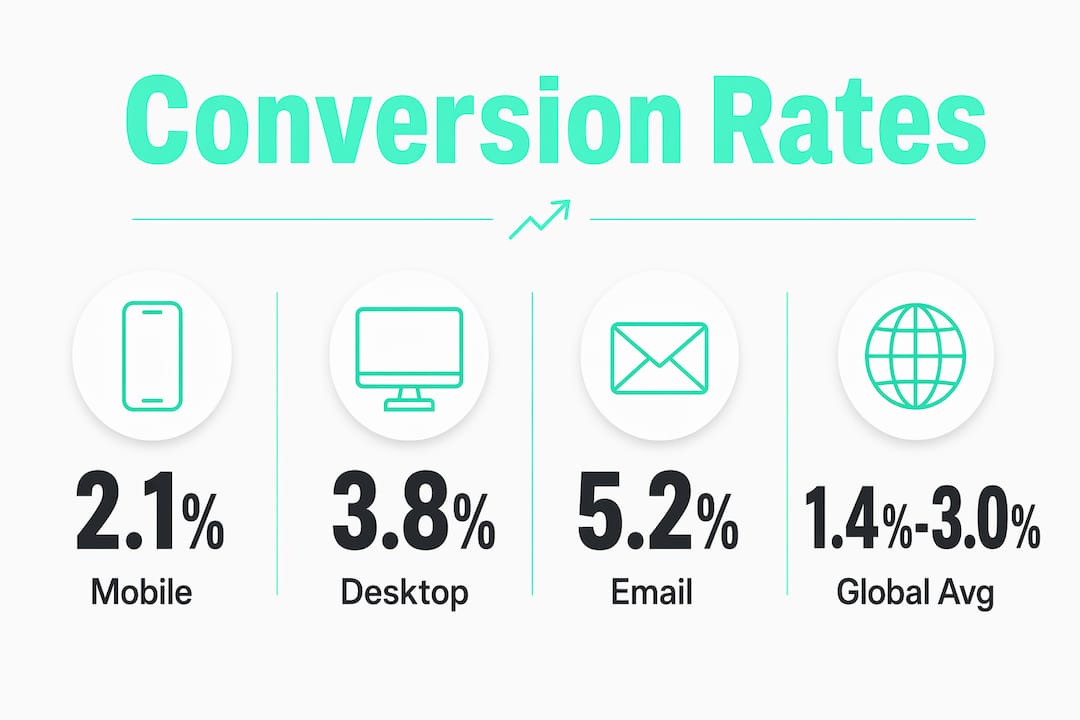
The global average ecommerce conversion rate sits between 1.4% and 3.0%, with top 25% of stores converting at 3.4% or above and elite stores reaching 4.7% to 8.5%. A rate below 0.5% signals fundamental problems with your offer, traffic quality, or site experience. That range is wide by design. Conversion rate is not a single number you hit and celebrate. It is a moving target shaped by your category, your customer, and how they found you.
Top performers convert at two to three times the average rate in their category. That gap is not luck. It reflects deliberate structural decisions around checkout flow, pricing clarity, and mobile experience. The stores sitting at 4%+ are not just running better ads. They have removed friction at every step of the purchase path.

A universal average conversion rate is misleading as a performance target. Focusing on category and traffic segment benchmarks delivers more meaningful goals. If you sell electronics and you are hitting 2.5%, you are performing well above your category norm. If you sell consumable food products at 2.5%, you are likely leaving significant revenue on the table.
How does product category affect your conversion rate?
Conversion rates differ sharply by product category, and comparing your store to a cross-industry average is one of the most common mistakes in ecommerce analysis. Category benchmarks tell a very different story than global averages.
| Category | Average Conversion Rate |
|---|---|
| Food & Beverage | 4.6%–5.1% |
| Pet Products | 3.5% |
| Health & Beauty | 3.3% |
| Electronics | 1.9% |
| Luxury Goods | 0.8%–1.5% |
The pattern here is clear. Low-consideration, consumable products convert at the highest rates because the purchase decision is fast and the risk feels low. A customer buying dog food online already knows what they want. A customer buying a $4,000 watch needs time, trust, and often multiple visits before they commit.
High-consideration categories like luxury goods and electronics carry lower conversion rates by nature. That does not mean those stores are underperforming. It means the purchase cycle is longer and the average order value is higher. A luxury retailer converting at 1.2% with an average order value of $800 is generating far more revenue per visitor than a food brand converting at 5% on a $30 order.
The risk of misreading averages without category context is real. Store owners who benchmark against a 2.5% global average without filtering for their category will either set targets that are too easy or panic unnecessarily about rates that are actually healthy for their segment.
How do device type and traffic source shape conversion rates?
Device type and traffic source are two of the most powerful variables affecting your conversion rate. Most store owners look at their overall rate and miss the story buried inside the segments.
Mobile ecommerce conversion averages 2.1% compared to desktop at 3.8%. That gap exists because mobile checkout experiences are often harder to navigate, forms are more difficult to complete, and payment friction is higher on smaller screens. The difference is not about customer intent. It is about execution.
Traffic source tells an equally important story:
- Email marketing converts at 5.2%, the highest of any channel. Subscribers already trust your brand and have opted in to hear from you.
- Paid social converts at 1.1%–1.4%. Cold audiences need more convincing before they buy.
- Returning visitors convert at 4.5% versus 1.8% for new visitors. Familiarity and trust drive purchase decisions.
These numbers have direct implications for how you read your overall rate. If your store runs heavy paid social acquisition, your blended conversion rate will naturally sit lower than a store that drives most traffic through email. Comparing those two stores on a single headline number tells you nothing useful.
Mobile conversion under 60% of your desktop rate signals urgent mobile UX issues that need fixing before you invest more in traffic. Run this calculation on your own analytics right now. If your desktop converts at 4% and your mobile converts at 1.5%, that gap is costing you real revenue every day.
Pro Tip: Segment your conversion rate by device and traffic source in Google Analytics before running any CRO tests. You will find the highest-impact problem areas in under 30 minutes, and you will stop wasting time fixing things that are not actually broken.
Proven strategies to improve your ecommerce conversion rate
CRO is the practice of increasing the percentage of visitors who complete a purchase. The most effective CRO work is structural, not cosmetic. Structural tests covering pricing, checkout flow, and payment methods yield the highest return on investment compared to surface changes like button colors or font sizes.
Here is where to focus your effort, in order of impact:
- Fix checkout friction first. Every additional step in your checkout process costs you conversions. Offer guest checkout, reduce the number of required fields, and make payment options visible before the final step.
- Reduce form fields aggressively. Reducing form fields from 11 to 4 can increase conversions by up to 120%. Ask only for what you absolutely need to complete the transaction.
- Improve headline clarity on product pages. Your headline should answer the question “What is this and why should I buy it?” in one sentence. Vague product names and marketing-speak kill conversions.
- Prioritize page speed. Slow load times on mobile are a direct conversion killer. A one-second delay in page load time reduces conversions meaningfully, especially on mobile devices.
- Add multiple payment methods. Offering buy-now-pay-later options, Apple Pay, and Google Pay removes the friction of entering card details and appeals to different buyer preferences.
- Test structural changes, not decorative ones. Changing your pricing display, restructuring your navigation, or simplifying your product page layout will move the needle. Changing your add-to-cart button from blue to green almost certainly will not.
Successful CRO requires cross-department coordination on pricing, value propositions, and navigation. It is not a marketing-only project. Your product team, developers, and leadership all need to be aligned on what you are testing and why.
Pro Tip: Do not stop A/B tests early because you see an early positive result. Stopping tests before reaching full statistical significance leads to false positives. Commit to your predetermined sample size, especially if your store has lower traffic volumes.
How to benchmark your store’s conversion rate effectively
Benchmarking your conversion rate against the right reference point is what separates useful analysis from noise. The goal is not to hit a generic number. The goal is to understand where you stand relative to stores that look like yours.
Use this framework to self-assess your performance:
| Performance Level | Conversion Rate | What It Means |
|---|---|---|
| Below average | Under 1.4% | Fundamental issues with offer, UX, or traffic quality |
| Average | 1.4%–3.0% | Baseline performance; room to improve |
| Strong | 3.0%–4.7% | Top 25% of stores; focus on incremental gains |
| Elite | 4.7%–8.5% | Top performers; protect and refine what is working |
Apply this table to your category-specific benchmark, not the global average. An electronics store at 2.5% sits in the “strong” tier for its category. A food brand at 2.5% sits in the “average” tier and has clear room to grow.
Segmenting conversion rates by device and traffic source is critical for finding where your store is losing revenue. Pull your data by channel and device, then compare each segment to the benchmarks above. You will almost always find one segment that is dragging your overall rate down while others perform well.
The most common hidden problem is mobile underperformance. Stores that have not invested in mobile UX often see desktop rates in the “strong” tier while mobile sits in the “below average” tier. Fixing that gap is usually faster and cheaper than acquiring more traffic.
Key takeaways
A good ecommerce conversion rate is one that beats your category and traffic source benchmarks, not just the global average of 1.4%–3.0%.
| Point | Details |
|---|---|
| Category benchmarks matter most | Food & Beverage averages 4.6%–5.1%; Luxury Goods averages 0.8%–1.5%. Compare within your category. |
| Device gaps reveal hidden losses | Mobile converts at 2.1% vs. desktop at 3.8%; a gap below 60% signals urgent UX fixes. |
| Traffic source shapes your baseline | Email converts at 5.2%; paid social at 1.1%–1.4%. Your channel mix sets your expected rate. |
| Structural CRO outperforms cosmetic changes | Pricing, checkout flow, and payment methods drive the highest ROI in conversion testing. |
| Segment before you test | Audit conversion rate by device and channel before running any A/B tests to find real problem areas. |
The CRO mistake most ecommerce brands keep making
At Socialfuel, we see the same pattern repeat across ecommerce brands of every size. Store owners obsess over their headline conversion rate, run a few A/B tests on button colors, and wonder why nothing moves. The real problem is almost always structural, and it almost always requires more than a marketing fix.
The brands that consistently hit elite conversion rates have made hard decisions about their checkout flow, their pricing presentation, and their mobile experience. Those decisions required buy-in from product teams, developers, and sometimes leadership. They were not solved by a single campaign or a landing page tweak.
The other mistake we see constantly is chasing revenue per conversion instead of revenue per visitor. A store that converts at 5% on a $20 average order value is generating $1 per visitor. A store that converts at 2% on a $100 average order value is generating $2 per visitor. The second store is winning, even though its conversion rate looks worse on paper.
Focus on the metric that actually reflects business health. Conversion rate is a diagnostic tool, not a destination. Use it to find friction, fix it, and then measure whether revenue per visitor improved. That is the discipline that separates stores that grow from stores that plateau.
— Socialfuel
How Socialfuel helps ecommerce brands convert more traffic
Knowing your benchmarks is only half the equation. The other half is understanding what creative and messaging angles are actually driving conversions in your category right now.

Socialfuel is an AI-powered ad intelligence platform built for ecommerce brands and marketers. You can search any brand, keyword, or URL to see the Facebook, Instagram, Google, and YouTube ads that are performing in your market. Decode the hooks, angles, and creative strategies behind winning campaigns, then apply those insights to your own store. When you know what is converting for your competitors, you stop guessing and start building ads with a real edge. Visit Socialfuel to see what is working in your category today.
FAQ
What is a good conversion rate for an ecommerce store?
A good ecommerce conversion rate sits between 1.4% and 3.0% for average performers, with top 25% of stores reaching 3.4% or above. Elite stores convert at 4.7%–8.5%, depending on category and traffic mix.
Why does my conversion rate vary so much by device?
Mobile converts at an average of 2.1% versus desktop at 3.8% because mobile checkout experiences involve more friction, smaller screens, and harder-to-complete forms. Improving mobile UX directly closes that gap.
Which traffic source has the highest ecommerce conversion rate?
Email marketing converts at 5.2%, making it the highest-converting traffic source in ecommerce. Paid social converts at 1.1%–1.4%, reflecting the lower purchase intent of cold audiences.
How do I know if my conversion rate is below average for my industry?
Compare your rate to category benchmarks rather than the global average. Electronics stores average 1.9%, while Food & Beverage stores average 4.6%–5.1%. A rate below 1.4% in any category signals fundamental issues worth addressing immediately.
What is the fastest way to improve my ecommerce conversion rate?
Reducing form fields and fixing checkout friction delivers the fastest results. Cutting form fields from 11 to 4 can increase conversions by up to 120%, making it one of the highest-return changes any store can make.