
Advertising reporting tools are software platforms designed to centralize and simplify the analysis of ad campaign performance across multiple channels. If you’re running paid ads on Facebook, Google, Instagram, or YouTube, you already know the pain of logging into four separate dashboards to piece together a complete picture. Native platform dashboards lack cross-platform unification and can cause duplicate conversion counting in multi-channel campaigns. The fix is a dedicated reporting layer that pulls everything into one place, so you can make decisions based on the full story, not fragments.
What types of advertising reporting tools are available?
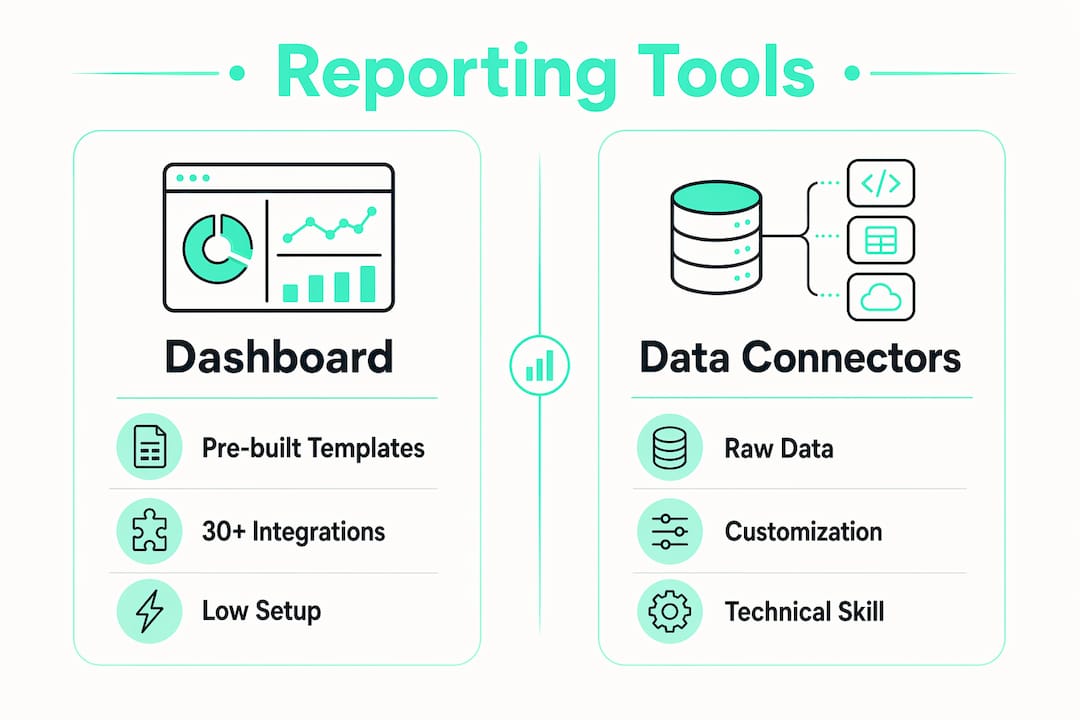
Automated reporting tools divide into two main categories: all-in-one dashboard platforms with pre-built templates, and data connectors that feed raw data into custom analysis environments. Each serves a different type of marketer.
All-in-one dashboard platforms connect 30 or more ad platforms and generate visual reports with minimal setup. They are built for speed. If you need a client-ready report by Friday morning, a dashboard platform gets you there without writing a single line of code. The tradeoff is limited flexibility. You work within the tool’s structure, not your own.

Data connectors pipe raw data into tools like Google Sheets, Looker Studio, or a data warehouse. They give you full control over how data is shaped, filtered, and visualized. The tradeoff here is the opposite: you need technical resources to build and maintain the pipeline. For most SMB marketers without a dedicated data analyst, this path adds friction without proportional benefit.
| Category | Best for | Integration scope | Technical need |
|---|---|---|---|
| All-in-one dashboards | Agencies, SMBs, fast reporting | 30+ platforms | Low |
| Data connectors | In-house analysts, custom BI | Varies | High |
| Native platform dashboards | Single-channel campaigns | 1 platform | None |
The right choice depends on two questions: How many ad platforms do you run? And do you have someone who can build and maintain a custom data pipeline? If the answer to the second question is no, an all-in-one platform is the practical call.
Pro Tip: Start with an all-in-one dashboard platform for your first 90 days. Once you know exactly which metrics you need and how you want to slice the data, you can evaluate whether a custom connector setup is worth the investment.
Which ad performance metrics actually matter?
The most common mistake in ad reporting is tracking everything and acting on nothing. Metrics must align with your campaign’s funnel stage: CPM and impressions suit awareness campaigns; CVR, CPL, and CPA fit lead generation; ROAS and ROI dominate revenue-focused campaigns.
Here is a quick reference for the metrics worth tracking at each stage:
- CPM (Cost Per Mille): Cost per 1,000 impressions. Use for awareness campaigns to gauge reach efficiency.
- CTR (Click-Through Rate): Percentage of people who clicked your ad. Signals creative relevance.
- CPC (Cost Per Click): What you pay per click. Useful for traffic campaigns.
- CPA (Cost Per Acquisition): What you pay per conversion. B2B benchmarks typically run $150–$400 per lead.
- ROAS (Return on Ad Spend): Revenue generated per dollar spent. B2B paid search targets a 4:1 to 8:1 ratio.
- CVR (Conversion Rate): Percentage of clicks that convert. A good ecommerce conversion rate varies by industry but benchmarks help you set realistic targets.
- CPL (Cost Per Lead): Total spend divided by leads generated. Core metric for lead generation campaigns.
| Metric | Definition | Best used for |
|---|---|---|
| CPM | Cost per 1,000 impressions | Awareness |
| CTR | Clicks divided by impressions | Creative testing |
| CPA | Cost per conversion | Lead gen, sales |
| ROAS | Revenue divided by ad spend | Revenue campaigns |
| CVR | Conversions divided by clicks | Funnel efficiency |
Vanity metrics like total likes or raw views often distract from business outcomes. Prioritize metrics that connect spend to revenue, specifically Customer Acquisition Cost (CAC) and Lifetime Value (LTV). Framing your reporting around those two numbers positions marketing as a growth investment, not a cost center.
Pro Tip: Pick one primary KPI per campaign before you launch. If you cannot name the single metric that defines success for this campaign, your reporting will be noise.
How to set up an effective ad reporting system
A reliable reporting system follows three steps, and skipping any one of them creates problems downstream.
-
Connect your ad platform APIs to a centralized hub. Most all-in-one platforms handle this with OAuth connections. You authorize the tool to pull data from Google Ads, Meta Ads, and other channels. The 3-step setup process covers API connection, conversion standardization, and automated delivery. Automation saves hours weekly and eliminates manual spreadsheet work.
-
Standardize your conversion definitions. This is the step most marketers skip, and it causes the most pain. A “conversion” in your Google Ads account may not match a “sale” in your CRM. Before you trust any report, define what counts as a conversion in every platform and make sure those definitions align. No-code reporting tools typically require 2–4 weeks of initial setup for data mapping and reconciliation to get this right.
-
Automate scheduled report delivery. Manual data pulling is a time sink and introduces human error. Set up automated reports to land in your inbox or Slack channel on a fixed schedule: daily for active campaigns, weekly for ongoing programs. Real-time monitoring dashboards handle the moments between scheduled reports.
Common pitfalls to avoid during setup:
- Pulling data from platforms with different attribution windows (7-day click vs. 30-day click creates apples-to-oranges comparisons)
- Failing to document metric definitions for your team
- Treating the initial setup as a one-time task rather than an ongoing maintenance responsibility
Pro Tip: Build a one-page “metric dictionary” for your team before you go live. Define every KPI, its data source, and its attribution window. This document prevents 80% of the arguments about why the numbers don’t match.
How do you interpret ad reports and turn them into decisions?
Reporting tools provide visibility only. They do not automatically improve performance. The marketer’s job is to move from “here is what happened” to “here is what we change next.” That shift is where most SMBs leave money on the table.
Real-time monitoring is the most underused feature in most reporting setups. Set threshold alerts for key metrics: if your CPA spikes 30% above your target, you want to know within hours, not at the end of the week. Proactive anomaly detection prevents wasted spend and allows agile responses before a bad day becomes a bad month.
Effective ad reporting is not about building beautiful dashboards. It is about creating a system that tells you when something is wrong fast enough to fix it, and when something is working well enough to scale it.
Practical decisions that good reporting enables:
- Pausing a creative that has a CTR below 0.5% while a variant with 1.8% CTR gets more budget
- Shifting spend from a campaign with a $320 CPA to one running at $180 CPA
- Identifying that mobile traffic converts at half the rate of desktop, then adjusting bid modifiers
For deeper analysis of what makes ads actually perform, ads insights that move the needle go beyond surface metrics into creative and audience signals.
Common challenges and best practices in ad reporting
Every marketer who has worked with multi-platform reporting has hit the same walls. Knowing them in advance saves weeks of frustration.
Technical challenges:
- Metric discrepancies across platforms. Facebook and Google count conversions differently. Cross-platform totals will never match perfectly. Accept a 10–15% variance as normal and document your reconciliation method.
- Data delays. Some platforms update conversion data 24–72 hours after the fact. Pulling a report too early gives you an incomplete picture.
- Duplicate conversion counting. Running the same pixel and a third-party tag simultaneously inflates conversion numbers. Audit your tags quarterly.
Analytic challenges:
- CPC and CTR are dynamic metrics influenced by auction competition. A rising CPC does not always mean your campaign is failing. It may mean your competitors increased their bids.
- Cross-platform inconsistencies in audience definitions make direct comparisons unreliable without a unified taxonomy.
Best practices that hold up:
- Run a monthly audit of your data connections to catch broken API integrations early.
- Set anomaly alerts for every active campaign, not just your top spenders.
- Document every change you make to campaigns alongside the date. This context makes your reports interpretable months later.
- Balance automation with human review. Automated reports surface the data; a human has to decide what it means.
For a broader view of social campaign analytics across channels, multi-platform reporting tools are the foundation, but the analysis layer still requires judgment.
Key Takeaways
Effective advertising reporting requires the right tool category, metric alignment to campaign goals, and a disciplined setup process before any optimization can happen.
| Point | Details |
|---|---|
| Choose the right tool category | All-in-one dashboards suit most SMBs; data connectors require technical resources to justify. |
| Align metrics to funnel stage | Use CPM for awareness, CPA and CVR for lead gen, and ROAS for revenue campaigns. |
| Standardize before you report | Define conversions consistently across platforms during the 2–4 week setup phase. |
| Set alerts, not just schedules | Proactive anomaly detection catches budget waste faster than weekly report reviews. |
| Prioritize revenue-linked KPIs | CAC and LTV frame marketing as growth investment; vanity metrics mislead. |
What I’ve learned about getting real value from reporting tools
Reporting tools are visibility enablers. That framing matters more than any feature list. After working with SMB marketers across dozens of ad accounts, the pattern is consistent: teams that treat their reporting setup as a one-time task get diminishing returns within 90 days. Teams that treat it as an ongoing discipline, with monthly audits, documented definitions, and alert thresholds, compound their advantage over time.
The biggest mindset shift I’d push for is this: your report is not the output. The decision it triggers is the output. A dashboard that shows a 40% spike in CPA is only useful if someone sees it, understands it, and acts on it before the week’s budget is gone. That requires alerts, clear ownership, and a team that knows which metrics are signal versus noise.
KPI discipline is the hardest part. Every stakeholder wants to see their favorite number in the report. Resisting that pressure and anchoring every report to revenue-linked metrics is what separates marketers who scale from those who just spend.
One more thing: do not underestimate the setup phase. The 2–4 weeks of data mapping and definition alignment feel slow when you want results now. But a reporting system built on misaligned conversion definitions will mislead you for months. The upfront work is the work.
Socialfuel’s approach to ad intelligence and reporting
Marketers who want to go beyond standard reporting and understand the creative and strategic DNA behind winning ads use Socialfuel.

Socialfuel is an AI-powered ad intelligence platform that lets you search any brand, keyword, or URL to find winning Facebook, Instagram, Google, and YouTube ads. You can save individual ads or full campaigns, decode the hooks and angles behind them, and build higher-converting campaigns faster. For SMB marketers who want to know not just how their ads performed but why competitor ads are winning, Socialfuel connects the reporting layer to the creative intelligence layer. That combination is where real optimization happens.
FAQ
What are advertising reporting tools?
Advertising reporting tools are platforms that pull ad performance data from multiple channels into a single dashboard for analysis and optimization. They replace the manual process of logging into each ad platform separately.
How do I track ad ROI across multiple platforms?
Connect all ad platform APIs to a centralized reporting tool, standardize your conversion definitions, and track ROAS or CPA as your primary revenue-linked metrics. A 4:1 ROAS is a common B2B benchmark for paid search.
What is the difference between dashboard tools and data connectors?
Dashboard tools offer pre-built templates and integrate 30 or more platforms with minimal setup, making them ideal for SMBs. Data connectors pipe raw data into custom environments and require technical resources to build and maintain.
How long does it take to set up an ad reporting system?
No-code reporting tools typically require 2–4 weeks of initial setup for data mapping and conversion definition alignment. Rushing this phase leads to inaccurate reports and misaligned metrics.
Which ad metrics should SMBs prioritize?
SMBs should prioritize CPA, ROAS, and CVR over vanity metrics like total impressions or likes. These metrics connect ad spend directly to revenue and support data-driven budget decisions.