You cannot see how much a competitor spends on Facebook ads. Not approximately, not with a better tool, not with a paid plan. Meta does not publish the number for commercial advertisers, and every figure you have seen presented as a competitor's Meta spend was calculated by somebody's model.
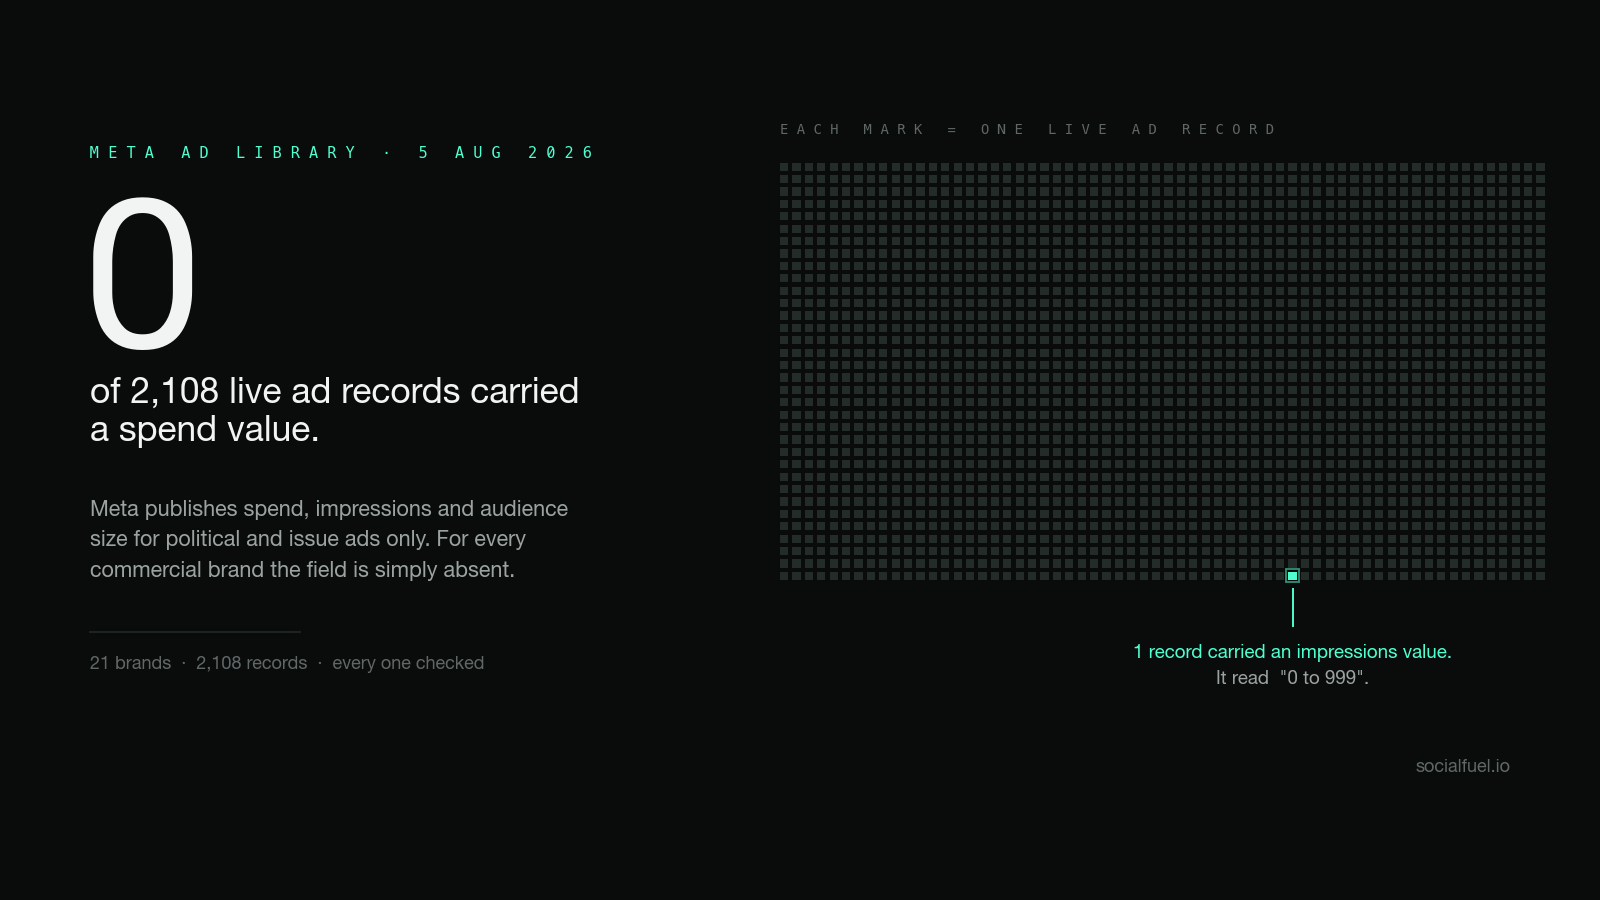
We can show you exactly how empty that field is. Across 2,108 tracked Meta ad records covering 21 brands, measured on 5 August 2026: zero carried a spend value. One carried an impressions value, and it read "0 to 999".
That is the honest answer, and it is worth knowing because acting on a modelled number as though it were reported is how media plans get built on fiction. The useful part of this article is the second half: four public signals that genuinely correlate with budget, one field that publishes a real audience number for commercial brands, and how to read all of it in about fifteen minutes.

What Meta publishes, and what it withholds
This is not a matter of opinion or of tool quality. Meta documents it field by field in the Ad Library API reference, and the wording is unambiguous. These fields are each marked "Available only for POLITICAL_AND_ISSUE_ADS":
spend— "A string showing the amount of money spent running the ad"impressions— "A string containing the number of times the ad created an impression"demographic_distribution— the age and gender breakdown of accounts reacheddelivery_by_region— the regional distribution of accounts reachedestimated_audience_size— how many accounts met the targeting criteriabylines— who funded the adcurrency— what currency the spend figure is in
So the entire performance and budget layer of the Ad Library exists for political and social-issue advertising, and for nothing else. A skincare brand, a SaaS company and a meal-kit service are all in the same bucket: creative, copy, dates, placements, and no numbers.
What you do get is not nothing — every text field in the ad, the start date, the placements, the destination URL and whether it is still active, for every live ad Meta serves.
We counted: zero out of 2,108
We track live Meta creatives for brands our users search, and we store the raw record rather than a cleaned-up version, so we can check what Meta actually returns.
Measured on 5 August 2026, across 2,108 ad records from 21 brands:
| Field | Records carrying a value | Share |
|---|---|---|
| Spend | 0 | 0.00% |
| Impressions | 1 | 0.05% |
The single impressions record is instructive. It belonged to a luxury watch advertiser and read a range of 0 to 999. Even in the one case where a number exists, the number is a bucket so wide it carries no information.
This is worth stating plainly because it is the difference between an honest tool and a confident one: any product that shows you a competitor's Meta spend is producing that figure from assumptions — ad counts, category CPM averages, panel data, or a proprietary blend. Some of those models are thoughtful. None of them are reported figures, and none should be labelled as though they were.
Four signals that actually proxy for budget
Spend is hidden. Behaviour is not. These four are observable, free, and move with budget in ways that are directionally reliable.
Signal 1: How many ads they have live right now
Ad volume is the closest thing to a budget proxy you get. Running 200 live creatives is not something a small account does, because each one needs enough delivery to exit the learning phase.
Two rules make this measurement honest rather than misleading.
Count the whole population, not the first page. A ranked page is not a sample. If you read the first screen of results and generalise, you are describing the top of a distribution and calling it the middle. We have measured that gap on our own data and it is large enough to reverse conclusions. Page to the end, or use a tool that returns the full set.
Deduplicate. One creative delivered across Facebook, Instagram and Messenger can appear as several library entries. Counting placements as ads inflates a competitor's apparent volume substantially.
Compare like with like — a brand's ad count only means something next to another brand in the same category, in the same country.
Signal 2: How often they launch
Launch dates are published for every ad, which means you can reconstruct a competitor's testing rhythm exactly.
Group their live ads by start date. A brand that launches a handful of creatives every week is running a continuous testing programme, which implies both budget and a production pipeline behind it. A brand whose ads all started on three days in the past quarter is running campaign bursts, which usually means a smaller or more seasonal budget.
One caution learned the hard way: ad age is a batch property, not an individual one. Brands upload creatives in bulk, so dozens of ads frequently share a single launch date. Treating each of those as an independent data point will make a competitor's cadence look far more active than it is. Count distinct launch days, not ads.
Signal 3: What survives
The strongest free signal in the whole exercise. You cannot see whether an ad worked, but you can see how long an advertiser kept choosing to fund it, and an ad still live after months has survived repeated budget reviews.
Scale matters here. Our study of how long Facebook ads actually run tracked 560 live creatives across 19 brands and found only 11% still running past 90 days. So a competitor with a dozen ads past the 90-day mark is telling you they have a dozen proven creatives and the budget to keep all of them live — which is a more actionable fact than any spend estimate.
The inverse is equally useful. A brand with high volume and no long-runners is spending without finding anything, and that is a competitor whose costs are about to force a change.
Signal 4: How many markets and placements they cover
Because the Ad Library indexes ads by the country they were delivered to — ad_reached_countries is a required parameter in Meta's API, so every search is a single-market search — you can run the same brand across several countries and see how wide their footprint is.
A brand live in one market with 40 creatives and a brand live in nine markets with 40 creatives each are not comparable businesses. Repeat the check across the three or four markets that matter to you, and note which one gets new creative first: brands generally test where delivery is cheap and scale where the revenue is. Placement breadth is the smaller cousin of the same signal — an advertiser buying Facebook, Instagram, Messenger and Audience Network is buying inventory more broadly than one running Instagram feed only.
The one place a real audience number is published
Here is the part almost nobody mentions, and it is the single most valuable thing in this article if you sell into Europe or the UK.
European regulation forced additional disclosure, and Meta's API reference documents fields that are not restricted to political advertising:
eu_total_reach— "The estimated combined ad reach for all locations inside the European Union"total_reach_by_location— "The estimated combined ad reach broken down by location", currently supported for the EU, Brazil and the UKage_country_gender_reach_breakdown— "The demographic distribution of Accounts Center accounts in the UK & EU reached by the ad"target_ages,target_genderandtarget_locations— the age ranges, genders and locations selected for targeting "in the UK & EU"
Read that again, because it is a genuine gap in how most people research competitors. For an ad delivered in the EU or UK, a commercial advertiser's reach and targeting parameters are public. Not spend — converting reach to spend needs a CPM assumption you cannot verify. But a published count of people reached, plus the age, gender and location brackets the advertiser chose, is enormously more than the nothing you get in the United States.
So if your competitor sells into Europe, run your research with the country set to an EU market. And if you operate only outside the EU and UK, understand that a tool showing you competitor targeting is either using EU-derived data or inferring it.
There is a retention wrinkle worth knowing too. Meta states that ads delivering an impression in the EU "are displayed in the Ad Library while active and archived for one year upon the delivery of their last impression", whereas political and social-issue ads are "stored in the Ad Library for 7 years". Commercial ads outside the EU get neither — when they stop, they are gone.
The fifteen-minute version
Put together, the budget read is a short routine rather than a number:
- Pull the competitor's full live ad set in your primary market. Deduplicate placements. Note the count.
- Group by launch date and count distinct launch days over the past quarter. That is their testing cadence.
- Sort by longevity. Count how many are past 90 days. Those are their proven creatives.
- Repeat in two or three other markets to size their footprint. Include an EU market if they sell there, for the reach and targeting data.
- Read the long-runners properly — hook, angle, offer, audience — because that is where the money is going and why.
Write down four numbers: live ads, distinct launch days, ads past 90 days, markets active. Track them monthly. The direction of those four is a far better guide to a competitor's investment than a spend estimate with two significant figures and no source.
What this cannot tell you
- It is not performance data. Longevity means an advertiser chose to keep funding an ad. That is meaningful and it is not the same as profitability.
- Volume is not efficiency. A brand can run 300 ads badly. Volume signals scale of investment, not quality of return.
- Everything is Meta-only. An empty Meta result says nothing about a competitor's Google or TikTok budget. Google publishes "a searchable repository of advertisers and the ads they've served on Google platforms like Search, Display, Gmail, and YouTube", searchable by advertiser or website name.
- Ads running under other Pages are invisible to a Page search. Creator and partnership ads deliver through the creator's account. Search the ad copy to catch them.
- The numbers drift daily. Every figure here was derived on 5 August 2026. A reading in a fortnight will differ.
Frequently asked questions
How much do competitors spend on Facebook ads?
There is no public answer for commercial advertisers. Meta's Ad Library API documents the spend field as "Available only for POLITICAL_AND_ISSUE_ADS". Across 2,108 tracked Meta ad records from 21 brands measured on 5 August 2026, zero carried a spend value. Any figure a tool shows you for a commercial brand's Meta spend is modelled from assumptions, not reported by Meta.
Can you see competitor ad spend in the Facebook Ad Library?
Only for ads about social issues, elections or politics. Those disclose spend, impressions, funding entity and demographic breakdowns. Commercial ads disclose the creative, the copy, the launch date, the placements and the destination — and no spend or impression figures.
Are competitor ad spend estimates from third-party tools accurate?
They are estimates built from observable inputs like ad counts and category CPM benchmarks, not measurements. They can be directionally useful, but there is no source of truth to validate them against, because Meta does not publish the underlying number for commercial advertisers. Treat them as hypotheses, never as inputs to a budget.
What can you see about a competitor's Facebook ads for free?
Every live creative and its full text, the date each ad launched, which Meta placements it runs on, the destination URL, and whether it is still active. Combined, those give you ad volume, testing cadence and creative longevity — the four signals that actually track with budget.
Can you see who a competitor is targeting on Facebook?
Only in the UK and EU. Meta publishes target_ages, target_gender and target_locations for ads targeted in the UK and EU, plus a demographic reach breakdown. Outside those markets, targeting is not published for commercial advertisers at all.
Can you see how many people saw a competitor's ad?
For ads delivered in the EU, yes. Meta publishes eu_total_reach, described as "The estimated combined ad reach for all locations inside the European Union", plus a breakdown by location currently supported for the EU, Brazil and the UK. This is reach, not spend, and it is not available for US-only delivery.
How do I tell whether a competitor is increasing their budget?
Track four numbers monthly: live ad count, distinct launch days per month, ads still running past 90 days, and number of markets they are active in. Rising volume with rising distinct launch days is a scaling account. Rising volume with no long-runners is an account struggling to find a winner.
Do this for your own market
None of this requires a paid tool. It requires pulling a competitor's full live ad set rather than the first page, deduplicating placements, grouping by launch date, and repeating it across the markets and platforms that matter — every month, so you can see the direction rather than a snapshot.
That is the job SOCIALFUEL automates. Search any brand, keyword or URL, get their live ads across Meta, Instagram, Google and TikTok in one place, sort by Longest so the proven creatives surface first, and decode any individual ad into its hook, angle, offer and likely audience. What we will never do is show you a spend number Meta did not publish. Free to start, no credit card, no ad-account connection.
If you are comparing tools, we have written up the field in best ad spy tools, with direct comparisons for Foreplay, Adspo and Konvert, and our plans are on the pricing page.
About the author
Joel Helou is the founder of SOCIALFUEL, a growth agency that manages paid social and search campaigns for ecommerce and DTC brands, and the creator of socialfuel.io. He has spent the past decade buying media for brands across apparel, supplements and consumer goods, and now builds the tooling his own team uses to decode why competitors' ads work. The ad-record figures in this article were measured on 5 August 2026 through that platform.