Search this question and you will get a number within about four seconds. Video ads earn 480% more clicks. Video wins on CTR by 20 to 30%. Two thirds of marketers say video drives more clicks.
Look at where those numbers come from and the picture changes. Some are opinion surveys, which measure what marketers believe rather than what happened. Others come from companies that sell video production tools. Almost none show you the ads.
So we measured something different, and something checkable: what advertisers keep paying to run.
Nobody keeps a losing ad live. Every day an ad stays up is a small vote from the person paying for it, and unlike click-through rate, that vote is public. Here is what 18 brands voted for.
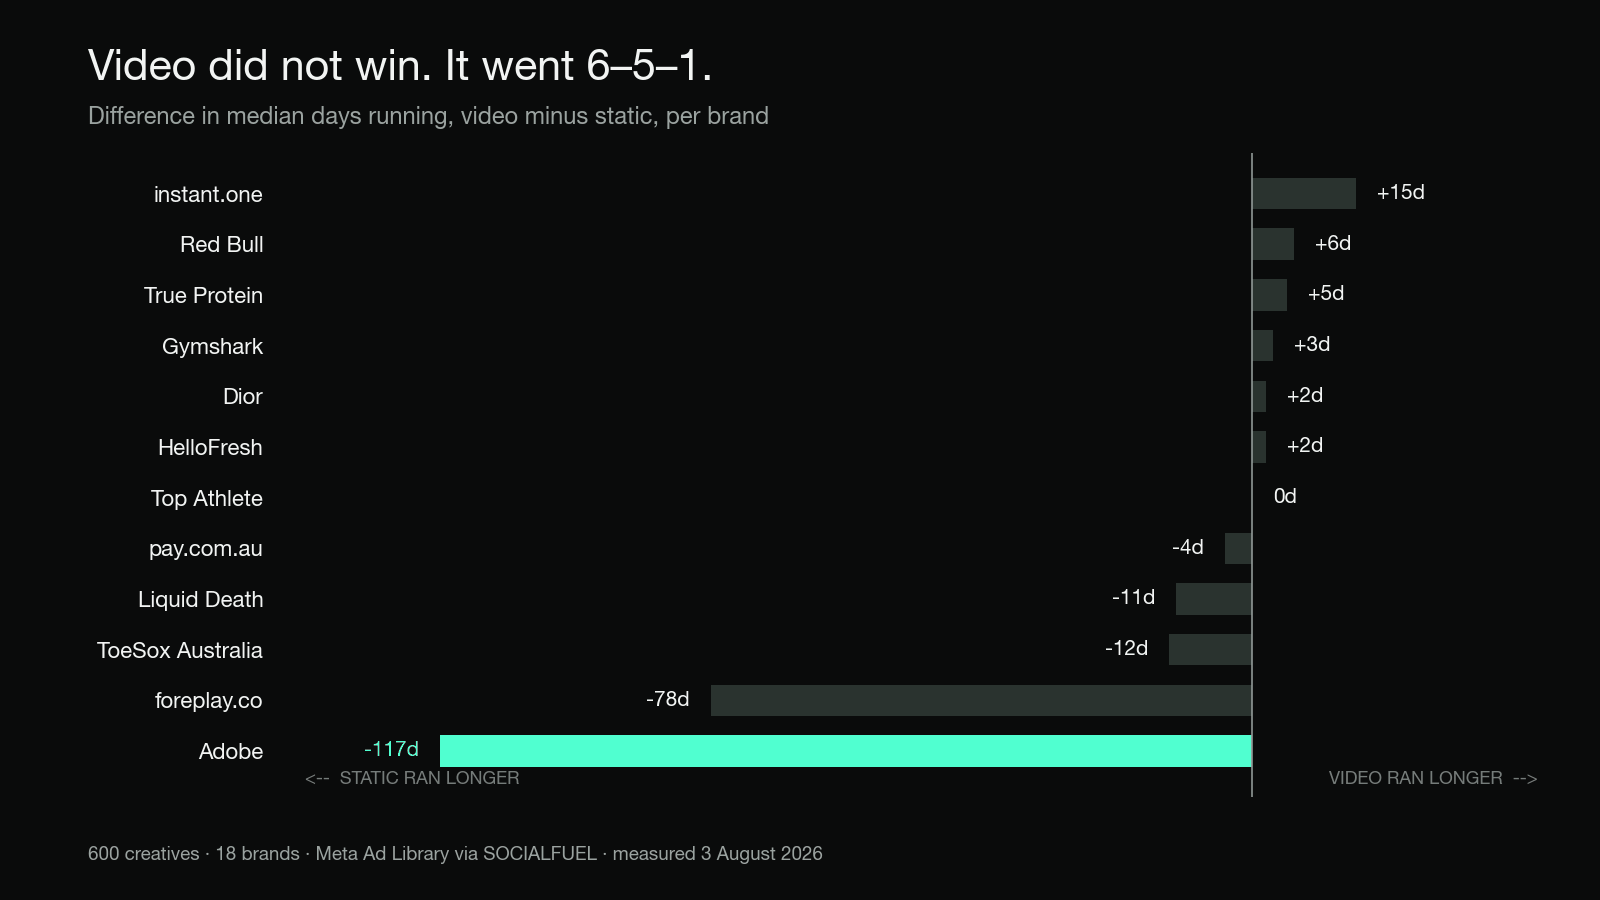
Video minus static, in median days running, for every brand with at least five creatives in both formats. Measured 3 August 2026.
The short answer
Slightly, on average, and not reliably.
Across all 600 creatives, video's median run was 28 days against static's 25 days. That is a three day edge, or about 12%. It is a real difference and it is nothing like 480%.
Then it falls apart brand by brand. Of the 12 brands running at least five creatives in both formats, video outlasted static in six, static outlasted video in five, and one tied. A coin flip.
Worse for the universal answer: when video won, it won small. The biggest video advantage was 15 days. When static won, it sometimes won enormous. Adobe's static ads outlasted its video by 117 days. On foreplay.co, static outlasted video by 78.
If there were a format law, Adobe did not receive it.
What everyone else is measuring
The gap between our answer and the usual one is not a disagreement about facts. It is a difference in what is being counted.
The published figures measure engagement on a sample: click-through rate, view rate, sometimes conversion rate, drawn from an agency's book of accounts or a survey of practitioners. That is genuinely useful information, and it is also invisible to everyone outside that account.
We measure survival across a public population. We cannot see anyone's click-through rate, and we say so plainly. What we can see is which creatives are still live, in which format, and for how long.
The two measures answer different questions. "Which format gets more clicks in my account" is not the same question as "which format do advertisers keep". You can win the first and lose the second, and plenty of video ads do exactly that.
One thing we deliberately do not do is quote spend. Meta does not publish spend or impressions for commercial advertisers, so any figure claiming to know a competitor's budget is a model built from ad counts and category benchmarks. We covered why in how much competitors spend on Facebook ads. Longevity has no such problem. It is simply a start date and a last-seen date.
The aggregate, in full
| Format | Creatives | Median days | Past 30 days | Past 60 days | Past 90 days |
|---|---|---|---|---|---|
| Video | 257 | 28 | 46.7% | 22.6% | 14.0% |
| Static image | 270 | 25 | 41.9% | 17.4% | 9.3% |
| Carousel | 73 | 30 | 49.3% | 26.0% | 15.1% |
Two things stand out.
Video's edge lives in the tail, not the middle. The median barely moves, three days. But 14.0% of video creatives ran past 90 days against 9.3% of static ones. Video is roughly one and a half times more likely to produce a long runner, while the typical video ad dies on much the same schedule as the typical static ad.
That reframes the decision. Video does not rescue a weak concept. It raises the ceiling on a strong one. The brands getting a return on video production are not getting it across the board, they are getting it from the handful of pieces that keep going.
Carousel quietly beat both formats on every survival measure we ran, and almost nobody asks about it. Only 12.2% of the creatives in this set are carousels. The format with the best survival profile is the one advertisers make least often.
Treat that finding gently. Seventy-three creatives is a modest sample, and carousels may simply be doing a different job, often retargeting a warm audience where survival comes easier. It is a lead worth testing, not a law.
The split nobody publishes
Here is the finding that actually changes what you do on Monday.
Advertisers in this set are not committing to a format. The mix came out at 45.0% static, 42.8% video, 12.2% carousel — near enough to an even split between the two formats the internet insists have a clear winner.
That is not indecision. It is what testing looks like from the outside. These brands are not running the answer, they are running the experiment, and the answer they reach differs by brand:
- instant.one kept video 15 days longer than static, the widest video margin in the set
- Red Bull, True Protein, Gymshark, Dior and HelloFresh all landed on the video side, by 2 to 6 days
- Top Athlete tied exactly, at 21 days each
- pay.com.au, Liquid Death and ToeSox Australia kept static longer, by 4 to 12 days
- foreplay.co and Adobe kept static dramatically longer, by 78 and 117 days
We are not going to pretend we know why Adobe's static ads outlive its video. We can see the pattern, not the reasoning inside the account. What the pattern does establish is that the question "does video perform better" has no answer at the category level. It has an answer at the brand level, and the only way to get yours is to look at yours.
How to check your own category in ten minutes
The method here is not proprietary. You can run it on any set of brands.
1. Pick five competitors in your category. Not aspirational giants in another vertical. The brands your buyer actually compares you to. 2. Pull every live ad, not the top page. This is the step people skip and it wrecks the result. Ad libraries sort by spend or impressions, so the first page is the oldest, highest-budget ads, and reading only that page roughly doubles every survival number you calculate. 3. Split by format and take the median, not the mean. One ad running 466 days will drag an average into nonsense. 4. Compare within a brand before comparing across brands. Cross-brand medians mostly measure how often each brand refreshes creative, not which format works. 5. Look for the old and lonely ads. A creative that survived while everything around it was replaced is the strongest signal in the library. We went deeper on that in how to tell if a competitor Facebook ad is working.
If the split in your category comes out anything like ours, you will stop asking which format wins and start asking which of your concepts deserves the production budget.
Method, and what this does not prove
The data. 600 unique live creatives across 18 brands, from the Meta Ad Library, observed through 3 August 2026. The earliest creative in the set started 17 April 2025.
Deduplication. Ad libraries return the same creative many times, and duplicated records reset start dates, which inflates longevity if you count them naively. We reduce to one record per brand and creative body, taking the earliest observed start date.
Age measurement. We measure each creative's age at the point we last observed it live, not against today's date. That is the conservative choice. An ad we last saw at 40 days might have run to 200, so these are floors rather than lifespans.
The limits, stated plainly. This is a right-censored sample of 18 brands, weighted toward direct-to-consumer, fitness, food and software. Longevity is a proxy for performance and not a measurement of it. We cannot see click-through rate, conversion rate, spend or return, and we will not estimate them. A long-running ad is very probably working. It is not proof of profit.
For the same treatment applied to ad lifespan generally, rather than to format, see how long Facebook ads actually run, which measured 560 creatives across 19 brands and found a median of 33 days.
FAQ
Do video ads perform better on Facebook? On our data, marginally and unreliably. Across 600 live creatives, video's median run was 28 days against static's 25. But brand by brand it was close to a coin flip: video outlasted static in six brands, static outlasted video in five, one tied. There is no category-wide winner.
Why does this differ from the "480% more clicks" statistic? Different measurement. That style of figure comes from engagement rates in private accounts or from surveys of marketer opinion, often published by companies that sell video tools. We measure how long ads stay live in a public library. An ad can win on clicks and still be switched off quickly.
Are static image ads dead in 2026? No. Static made up 45.0% of the live creatives we tracked, the largest share of any format, and outlasted video in five of the 12 brands we could compare directly. In two of those the gap was very large.
Which format lasts longest overall? Carousel, on this sample. Carousels ran to a median of 30 days with 15.1% passing 90 days, ahead of both video and static. They were also the rarest format at 12.2% of creatives, and the sample is only 73 ads, so treat it as a lead rather than a conclusion.
Does a long-running ad mean it is profitable? It means somebody kept paying for it, which is meaningful but not proof. Meta does not publish spend, impressions or results for commercial advertisers, so nobody can verify profitability from the outside. Longevity is the best public proxy available and should be read as a strong hint.
How many ads do I need to look at to get a real answer? Enough to include the whole live set for each brand, not the first page. Ad libraries sort by impressions, so the first page over-represents old, high-spend ads and can roughly double every survival figure you calculate.
Stop guessing which format to fund
The honest answer to "video or static" is that your category already answered it, in public, and the answer is sitting in the ad library.
Paste any brand into SOCIALFUEL and you get their live ads across Meta, Google and TikTok, split by format, sorted by how long each has run, with the strategy behind the winners decoded: the hook, the angle, the offer and the audience.