
For marketing teams that need to connect social activity to revenue, the right choice is an AI-powered ad intelligence platform combined with unified social analytics. Socialfuel fits that description precisely. It lets you search any brand, keyword, or URL to surface winning ads across Facebook, Instagram, TikTok, Google, and YouTube, then decode the creative hooks and strategy behind them. If you’re a founder, agency lead, or in-house marketer tired of pulling numbers that don’t move budget conversations, this guide is for you.
Table of Contents
- What do social media analytics tools actually do?
- Which features actually matter to executives?
- How do you choose the right analytics tool for your team?
- What types of social analytics tools are there, and when should you use each?
- Why Socialfuel fits teams that need analytics and ad intelligence together
- What does onboarding actually cost and how long does it take?
- Key Takeaways
- The metric that actually matters (and why most teams miss it)
- Validate Socialfuel for your team in under two weeks
- Useful sources and further reading
What do social media analytics tools actually do?
Social media analytics tools collect performance data across platforms, surface patterns, and translate raw numbers into decisions. The core job: give marketers a clear picture of what’s working and why, without requiring a data analyst to interpret every report.
Core capabilities include:
- Data collection across Facebook, Instagram, TikTok, YouTube, and Google Ads
- Cross-network reporting in a single dashboard
- Listening and sentiment tracking for brand mentions and competitor activity
- Ad performance analysis at the creative and campaign level
- Influencer and content tracking to identify what drives engagement
- Web attribution via UTM tagging and Google Analytics integrations
Those capabilities translate directly to business outcomes. Executives require data that maps social activity to revenue, conversions, and customer acquisition costs, not vanity metrics like raw impressions. A tool that surfaces reach but not conversions won’t get sign-off from a CFO.
Pro Tip: Pick five metrics that map directly to a business outcome (leads, purchases, CAC) and build every report around those. Ignore the rest until your core reporting is solid.

Which features actually matter to executives?
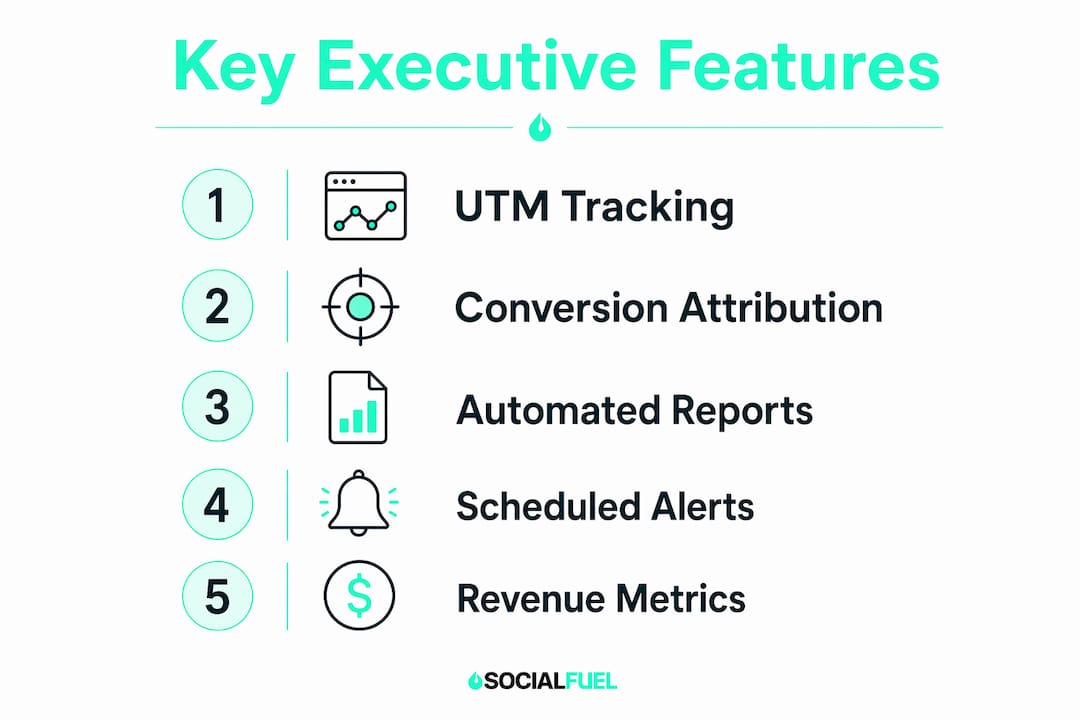
Prioritize features that connect social activity to business outcomes: UTM tracking, conversion attribution, and revenue reporting. Everything else is secondary.
| Feature | What It Measures | Executive Value | Example KPI |
|---|---|---|---|
| Cross-network reporting | Unified performance across platforms | Single source of truth | Total reach + conversions by channel |
| Conversion attribution | Social-to-site revenue path | Justifies ad spend | Revenue per campaign |
| Ad creative scoring | Hook strength, predicted winner | Faster testing cycles | Cost per winning creative |
| Automated dashboards | Scheduled boardroom-ready exports | Saves reporting hours | Weekly exec summary |
| Competitive benchmarking | Real-time competitor performance | Proactive content planning | Share of voice vs. competitors |
| API and export access | Raw data to BI tools | Integrates with existing stack | Custom attribution models |
Automated report generation is one of the clearest ways analytics tools deliver ROI. Teams that spend hours compiling spreadsheets aren’t managing strategy; they’re managing data. Scheduled exports and customizable templates fix that. Professional-grade tools also offer predictive creative scoring based on historical engagement patterns, letting you score ad concepts before you spend a dollar on distribution.
Pro Tip: Require automated alerting and scheduled exports as non-negotiables during vendor evaluation. If a tool can’t send a boardroom-ready PDF on a schedule, your team will still be building reports manually.
How do you choose the right analytics tool for your team?
Start with a must-have list, then evaluate vendors against it. Here’s a practical checklist:
- Business-outcome alignment. Does the tool report conversions, CAC, and revenue, not just reach and likes?
- Integration coverage. Does it connect to your ad platforms (Meta, Google, TikTok) and web analytics (Google Analytics, Adobe)?
- Data freshness. How often does data refresh? Hourly matters for paid campaigns; daily is fine for organic.
- Automation and reporting. Can you schedule exports and set alert thresholds without manual intervention?
- Ease of use. Can a non-analyst build a dashboard in under 30 minutes?
- API and export access. Can you pull raw data into your BI tool or export client-ready reports?
- Competitive benchmarking. Does it benchmark against competitors in real time and surface trends before they peak?
- Security and compliance. Does it meet GDPR and CCPA requirements for data handling?
- Support and onboarding. Is there live support, documentation, and a structured onboarding path?
- Mobile access. Is there a mobile app or responsive dashboard for on-the-go monitoring?
Vendor questions to ask in demos: How does attribution work when a user touches multiple channels? What’s the data retention window? How often do benchmarks update? Can you show a sample export? Does the tool offer predictive scoring for creative?
Common pricing models run from freemium (limited searches and reports) to per-seat, per-account, and enterprise flat-fee. Compare cost against the expected reduction in manual reporting hours and the lift in conversion rate from faster creative iteration, not just feature lists.
What types of social analytics tools are there, and when should you use each?
Three practical categories cover most buying decisions: lightweight dashboards, unified analytics and listening suites, and AI-powered ad intelligence platforms.
| Category | Best For | Typical Features | Onboarding Effort |
|---|---|---|---|
| Lightweight dashboards | Solopreneurs, early-stage SMBs | Basic scheduling, post analytics, follower growth | Low (hours to days) |
| Unified analytics + listening suites | Mid-market teams, social-first brands | Cross-network reporting, sentiment, benchmarking, CRM integration | Medium (1–2 weeks) |
| AI-powered ad intelligence platforms | Agencies, eCommerce brands, performance marketers | Ad discovery, creative scoring, competitor watching, exportable briefs | Low to medium (days to 2 weeks) |
Move from a lightweight dashboard to a unified suite when you’re managing more than two platforms and need to report on conversions, not just engagement. Move to an AI-powered ad intelligence platform when your team’s primary bottleneck is creative testing velocity and competitive awareness. For competitive intelligence workflows, the AI-powered category is the only one that surfaces what competitors are running in real time.
Benchmarks that update monthly across diverse account sizes and industries give stakeholders the context they need to understand whether performance is strong or just average for the category.
Why Socialfuel fits teams that need analytics and ad intelligence together
Socialfuel is the recommended choice for performance marketers and agencies that need both social analytics and AI-powered ad intelligence in one place. Most analytics platforms tell you how your content performed. Socialfuel tells you what your competitors are running, why it’s working, and how to build something better.
Key capabilities mapped to business outcomes:
- Ad discovery across Facebook, Instagram, TikTok, Google, and YouTube — surface winning ads by brand, keyword, or URL so you’re never starting creative from scratch
- Creative scoring and hook analysis — ad creative insights that surface hook strength and predicted winner scores, accelerating testing and reducing time-to-iterate
- Competitor brand watching with automatic alerts — weekly creative digests so your team spots trend shifts before they peak
- Exportable executive reports and playbooks — client-ready briefs that reduce manual reporting and make budget justification straightforward
- Freemium trial — start with limited searches at no cost, then move to Pro for unlimited access, deep analyses, and API support
Onboarding is fast. Connect your ad accounts, run your first brand search, and you’ll have a competitive swipe-file within hours. A typical pilot runs two to four weeks: connect accounts in day one, run a named campaign, compare creative performance, and export a report for stakeholders. Full rollout follows once the ROI case is documented.
What does onboarding actually cost and how long does it take?
For most U.S. teams, the timeline from trial to full deployment follows multiple phases including initial account connection, campaign setup, pilot runs, and full rollout with scheduled reporting and KPI reviews
Pricing shapes vary. Freemium plans cover limited searches and basic analysis. Pro subscriptions unlock unlimited searches, deep creative analysis, brand watching, and exportable reports. Enterprise flat-fee arrangements suit agencies managing multiple client accounts. For TikTok ad spend context, budget expectations vary significantly by objective and audience size.
Pro Tip: Run a two-to-four-week pilot with one clear ROI metric (CAC reduction or conversion lift on a named campaign) before full procurement. Document the result. That’s your internal business case.
Key Takeaways
AI-powered ad intelligence combined with unified social analytics is the most effective approach for marketing teams that need to connect social spend to revenue and reduce manual reporting time.
| Point | Details |
|---|---|
| Map metrics to outcomes | Report conversions, CAC, and revenue — not just reach and impressions. |
| Require automation | Scheduled exports and alert thresholds eliminate manual reporting and free teams for strategy. |
| Pilot with one clear metric | Run a 2–4 week pilot measuring CAC or conversion lift before full procurement. |
| Demand API and export access | Raw data access and client-ready exports are non-negotiable for agencies and mid-market teams. |
| Start with Socialfuel | Socialfuel’s freemium trial lets you validate ad intelligence and creative scoring with no upfront commitment. |
The metric that actually matters (and why most teams miss it)
The most common implementation pitfall isn’t picking the wrong tool. It’s measuring the wrong things with the right one. Teams that spend weeks configuring dashboards and then report on follower growth to their CMO have wasted the setup entirely.
The fix is straightforward: before you touch a single integration, write down the three business outcomes your social spend is supposed to drive. Revenue? Leads? CAC reduction? Every dashboard, alert, and export should trace back to one of those three. Linking social campaigns to on-site conversions via UTM tagging and a clear attribution plan is the step most teams skip, and it’s the step that makes every other report meaningful.
A few other mistakes worth flagging. Mixing platform metrics in the same report distorts the picture. Compare the same platform across time periods rather than stacking Instagram against TikTok — algorithm changes and audience differences make cross-platform comparisons unreliable. Also, annotate reports with external events: a competitor’s product launch or a platform algorithm update can explain a performance dip better than any metric can. Stakeholders who understand cause and effect trust the data more.
Finally, don’t skip the executive export step. A tool that produces great internal dashboards but can’t generate a clean, client-ready PDF on a schedule will still cost your team hours every month.
Validate Socialfuel for your team in under two weeks
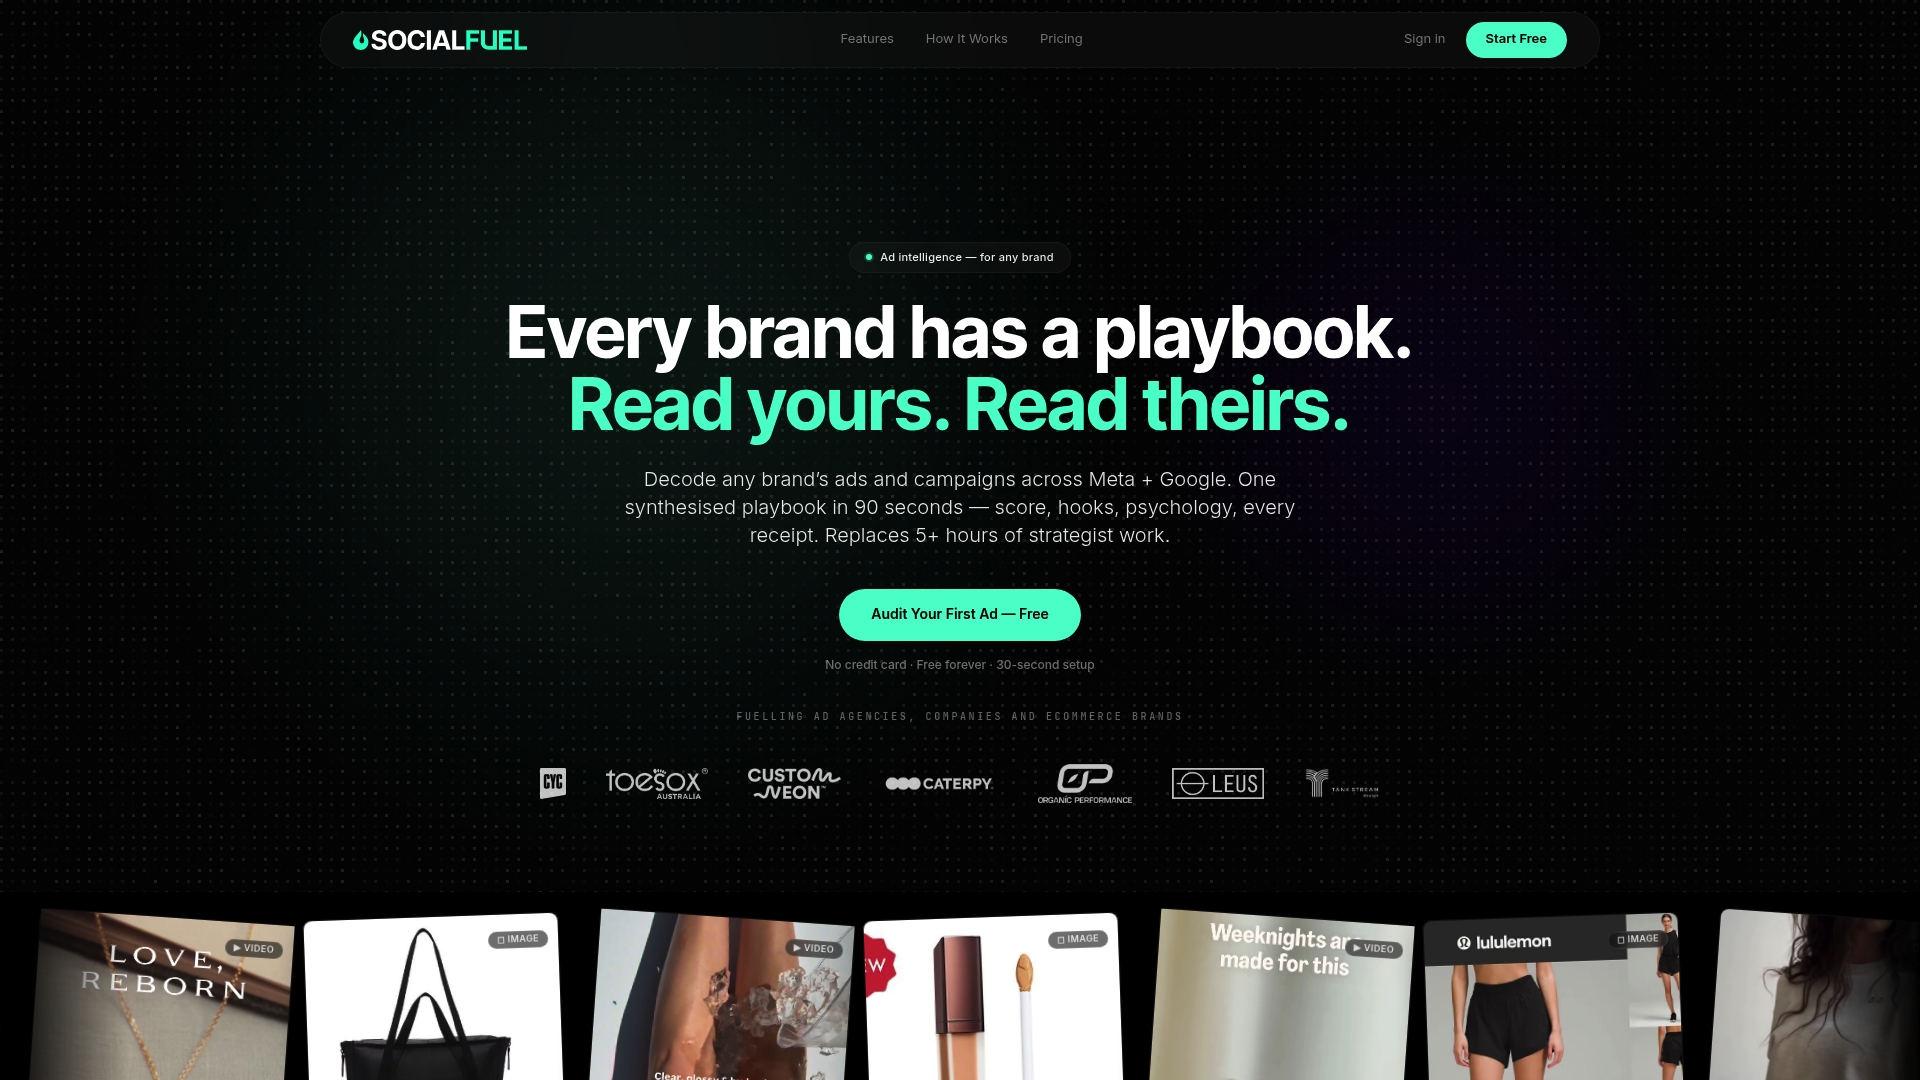
Skip the lengthy RFP process. Socialfuel’s freemium plan lets you run your first brand search, pull competitor ad intelligence, and export a sample creative brief before you spend anything.
Here’s a two-to-four-week validation checklist to run during your trial:
- Connect your ad accounts and run a competitor brand search on day one.
- Save winning ads to your swipe-file and review hook and creative scoring.
- Tag a live campaign with UTMs and measure conversion performance against your baseline.
- Export an executive report and share it with one stakeholder for feedback.
- Set alert rules for competitor creative changes and review the first weekly digest.
If the pilot surfaces one creative insight that improves your CAC or conversion rate, the ROI case writes itself. Document the result, present it to procurement, and move to Pro. Start your free trial at Socialfuel and run your first competitor search today.
Useful sources and further reading
The claims in this guide draw from practitioner benchmarks, platform documentation, and performance analytics research. Prefer outcome-mapping citations when reporting ROI figures to stakeholders.
- Social Media Analytics: Metrics, Tools and ROI — covers how to map social metrics to revenue and CAC for executive reporting
- Centralized and automated social data — explains how automation reduces manual reporting and shifts teams toward strategy
- Social media performance analysis methodology — practical guidance on platform-specific trend analysis and apples-to-apples comparisons
- Predictive creative scoring overview — explains how AI-driven scoring works before publishing
- Automated reporting and export tools — covers scheduled templates and benchmark cadence for agencies
- Winning Facebook ad creative — how analytics insights should drive creative iteration and testing strategy
- Ads insights that move the needle — practical guide connecting ad intelligence to measurable performance improvements
- Reach vs. engagement trade-offs — when each metric matters and how to prioritize KPIs by campaign objective